
Sunny Storage · Clermont, Florida
Self-Storage Demand Drivers: Who Rents and Why (2026)
Self-storage is rarely something people plan to buy. A unit gets rented because something changed: a move, a new job, a marriage or a divorce, a parent moving in, a home sale that closes before the next one is ready, a small business that outgrew the garage. If you develop, own or run self-storage, those life events are your demand. Population growth matters because it multiplies them, not because new residents rent storage simply by arriving.
This guide explains who rents self-storage and why, using only free, primary and dated sources: U.S. Census Bureau survey tables, a free excerpt of the Self Storage Association’s 2025 Demand Study, and the annual reports (Form 10-K) of three of the largest public self-storage operators. For the statewide numbers behind this topic, see our Florida self-storage market overview.
All figures were checked on November 4, 2026. Totals and shares we calculated ourselves are labeled “(our arithmetic).”
The short version
- About one in eight U.S. households uses self-storage. The SSA estimates 12.6% in 2024, up from 9.0% in 2005.
- Moves are the biggest single trigger, but Americans move far less than they used to. The share of people who moved in a year fell from 20.2% in 1985 to 7.8% in 2023 (Census CPS).
- Housing reasons lead. In 2023, 41.3% of movers moved for housing-related reasons, 22.7% for family reasons and 21.0% for job-related reasons.
- Renters move about four times as often as owners: 16.2% vs 4.1% in 2023.
- Businesses rent too. All three large public operators describe their units as being for personal and business use, or for residential and commercial customers.
- Demand has a season. The same filings link higher summer demand or occupancy to moving activity.
How many households use self-storage?
The Self Storage Association (SSA), the industry’s trade group, has run a national demand study seven times since 2004. The full 2025 edition is a paid report, but the SSA has published a free excerpt that includes the headline penetration figures. The survey was fielded in February and March 2025 and describes 2024.
| Year | Total U.S. households | Households renting self-storage | Share |
|---|---|---|---|
| 2005 | 112,116,531 | 10,032,740 | 9.0% |
| 2013 | 121,165,766 | 10,855,031 | 9.0% |
| 2020 | 127,679,093 | 13,495,671 | 10.6% |
| 2024 | 132,391,926 | 16,681,383 | 12.6% |
The SSA puts the margin of error on its household penetration estimate at plus or minus 1 percentage point. The study’s own summary says household usage “has risen” since 2013, “peaking in 2024.” In plain terms, the number of renting households grew by about 6.6 million from 2005 to 2024 (our arithmetic), much faster than households overall.
That is a national figure. It doesn’t tell you the share in Florida, in Lake County or around a specific site, and the excerpt does not include the study’s reasons for renting. For those, we turn to Census data on the life events behind storage.
Driver 1: Moving, and why Americans move less
Moving is the life event most closely tied to self-storage. All three large public operators link their busiest season to it (see Driver 6). The Census Bureau’s Current Population Survey (CPS) measures how many people lived somewhere else a year earlier.
| Survey year | Share of people (age 1+) who moved in the past year |
|---|---|
| 1985 | 20.2% |
| 2000 | 16.1% |
| 2023 | 7.8% |
In 2023 that was about 25.6 million movers out of 327.2 million people. The long decline is one of the most important facts for anyone modeling storage demand: a market can grow in population while the number of moves per person falls. Demand estimates built on old mobility rates will overstate it.
Why people move
The CPS also asks movers for their main reason. The latest published table covers the 2023 survey (released December 2024):
| Main reason for moving (2023) | Share of movers |
|---|---|
| Housing-related, total | 41.3% |
| Wanted a newer, better or larger home | 13.8% |
| Wanted cheaper housing | 9.4% |
| Wanted to own a home, not rent | 6.8% |
| Family-related, total | 22.7% |
| To establish own household | 9.7% |
| Change in marital status | 5.1% |
| Job-related, total | 21.0% |
| New job or job transfer | 12.5% |
| Retired | 1.3% |
| Other reasons, total | 15.0% |
| Relationship with an unmarried partner | 4.5% |
| To attend or leave college | 2.8% |
| Health reasons | 1.7% |
Only the largest categories are shown, so the rows don’t add up to each total. Each of these reasons has a typical storage need. People trading up or down need space between closings. A new household starts with less room than it will have later. Divorce and separation split one home’s belongings between two. A job transfer can mean storing furniture while you look for a place. Retirement often means a smaller home. A storage study should ask which of these reasons are common in its trade area, not just how many people live there.
Driver 2: Renters move more than owners
Housing tenure, whether people own or rent their home, is a strong predictor of how often they move. In the 2023 CPS:
- 16.2% of people living in renter-occupied homes had moved in the past year.
- 4.1% of people living in owner-occupied homes had moved.
People in renter-occupied homes were about 30.9% of the population age 1 and over but about 63.8% of all movers (our arithmetic). Areas with many apartments and rental homes produce more moves per resident. Areas dominated by owner-occupied homes produce fewer moves, though each one tends to involve a full household of belongings.
Driver 3: Housing market activity
Moves follow housing transactions, and the large operators say so in their risk disclosures. In its annual report for fiscal year 2025, Extra Space Storage lists “decreases in the volume of housing market transactions” among the factors that may hurt its operations, alongside unemployment and changing demographics. CubeSmart writes that its “results of operations are also sensitive to changes in the residential housing market, as adverse changes in this market could reduce consumer demand.” Public Storage names “reductions in employment and population levels, household and disposable income” among the factors that can lower demand.
For a local study, that points to a few free indicators worth tracking over time: building permits, new subdivisions, and how often homes and apartments change hands in the trade area.
Driver 4: Business customers
Self-storage is not only a household product. Public Storage describes its spaces as “for personal and business use.” Extra Space says its stores “offer month-to-month rental of storage space for personal or business use.” CubeSmart says its stores serve “residential and commercial customers.”
Typical business uses include inventory for online sellers, tools and materials for contractors, documents and records, seasonal stock, and equipment for mobile service businesses. The Census Bureau counts the businesses behind that demand. Its nonemployer statistics cover businesses with no paid employees, many of them sole proprietors who work from home. There were 31,985,874 nonemployer establishments in the U.S. in 2024, including 3,427,341 in Florida and 43,033 in Lake County (Census QuickFacts). A count of businesses is not a count of storage renters, but it shows where small, space-hungry businesses are concentrated.
Driver 5: Age, life stage and downsizing
Life stage shapes storage needs. Young adults form households and move often. Families add space needs as children arrive. Older adults may downsize, combine households or settle an estate. Public data does not measure downsizing directly, so treat it as a question for local research, not a statistic.
What Census data does show is how different local age profiles can be. Lake County’s population is much older than the nation’s (see the table below). In the CPS, 1.3% of movers in 2023 cited retirement as their main reason and 1.7% cited health. Those are small national shares, but they can matter more in a county with many retirees.
Driver 6: Seasonality
Demand also moves through the year. All three large public operators describe the same pattern in their annual reports for fiscal year 2025:
- Public Storage: “We experience minor seasonal fluctuations in the demand for self-storage space, with demand and rental rates generally higher in the summer months than in the winter months. We believe that these fluctuations result in part from increased moving activity during the summer months.”
- Extra Space Storage: occupancy levels are “generally higher in the summer months due to increased moving activity.”
- CubeSmart: occupancy is “generally slightly higher during the summer months due to increased moving activity.”
For an operator, that means staffing, marketing and pricing should follow the calendar. For a developer, it means opening date and lease-up assumptions should account for the season. In Florida, the Atlantic hurricane season (June 1 to November 30) adds another layer of short-term demand for some households; our hurricane season storage checklist covers it from the tenant side.
Florida and Lake County through the same lens
How do these drivers look locally? Census QuickFacts lets you compare the nation, the state and the county on several of them:
| Indicator (Census QuickFacts) | United States | Florida | Lake County |
|---|---|---|---|
| Population growth, Apr. 1, 2020 to July 1, 2025 (V2025) | 3.1% | 8.9% | 18.8% |
| Persons 65 years and over (V2025) | 18.9% | 22.8% | 28.0% |
| Owner-occupied housing unit rate (ACS 2020–2024) | 65.2% | 67.6% | 77.6% |
| Living in the same house 1 year ago (ACS 2020–2024) | 87.7% | 86.3% | 88.2% |
| Persons per household (ACS 2020–2024) | 2.53 | 2.51 | 2.48 |
| Building permits, 2025 | 1,431,616 | 178,297 | 5,342 |
| Nonemployer establishments, 2024 | 31,985,874 | 3,427,341 | 43,033 |
The comparison shows why one driver never tells the whole story. Lake County is growing about six times as fast as the nation in percentage terms (our arithmetic), yet it has a higher ownership rate and slightly fewer people moving each year than Florida as a whole. Read together, that suggests demand driven more by new arrivals, new homes and life-stage changes than by renter turnover. That is a hypothesis to test with local research, not a conclusion.
Florida also has a large flow of people crossing state lines. In the Census Bureau’s 2024 state-to-state migration table (released January 21, 2026), 573,876 people moved to Florida from other states and 506,246 moved from Florida to other states, a net gain of 67,630 (our arithmetic). Another 288,048 moved to Florida from abroad. Both directions create storage needs: people arriving between homes and people preparing to leave.
What public data can’t tell you
Demand drivers describe people, not facilities. Free public sources do not tell you:
- How many self-storage facilities and how much rentable space already serve a trade area.
- What is planned or under construction nearby.
- Local rental rates, occupancy or concessions.
- The share of local households that rent storage.
Those answers come from paid industry databases, broker research, planning and permit records, and a field survey of nearby facilities. A strong demand story with no supply analysis is only half a feasibility study.
Turning demand drivers into a site study
- Define the trade area by drive time, not by county or city lines.
- Profile the life events in it: growth, tenure, age, household size, new permits and business counts, each with its source and date.
- Adjust for today’s mobility. Use current mover rates, not rates from decades ago.
- Match the product to the drivers. Areas with many movers and renters may favor smaller, flexible units. Areas with large owner households, downsizing or business users may need larger units and drive-up access. Our storage unit size guide shows how tenants think about the same choice.
- Plan for the season in opening dates, staffing and marketing.
- Survey supply before deciding the building is viable.
- Bring design and construction in early, so unit mix, climate control and site layout follow the demand you found. Learn about our design-build services.
A real example in Lake County
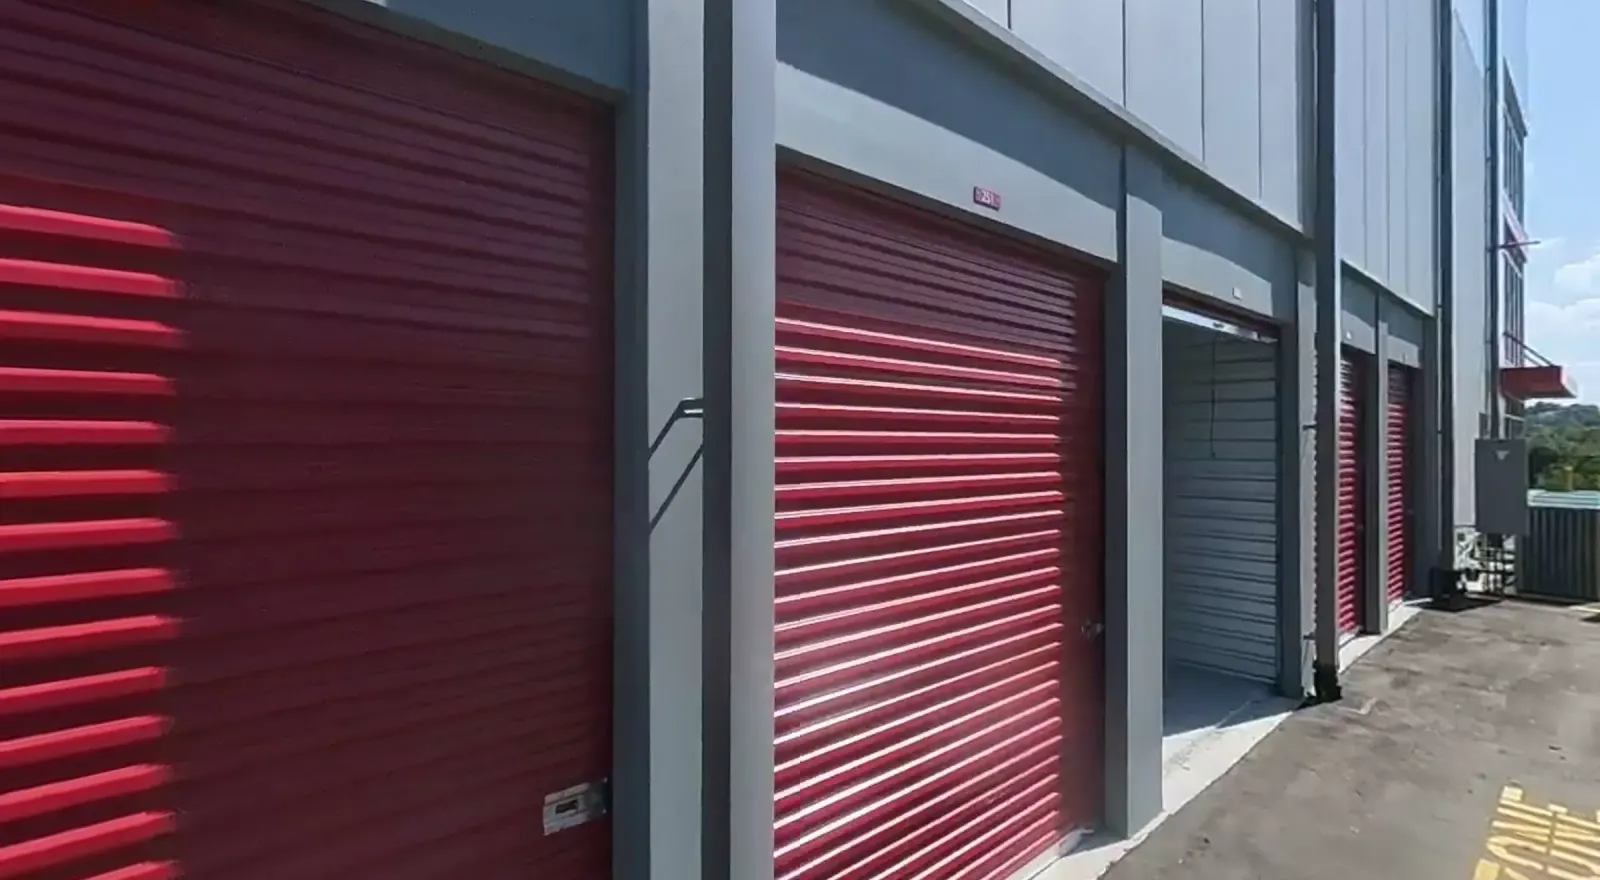
Sunny Storage at 1140 Hooks St, Clermont, FL serves Lake County, whose population grew 18.8% from April 2020 to July 2025 (Census QuickFacts V2025). Designed and built by i4 Capital Group, owned and operated by Sunny Storage, an affiliated company. Unit sizes include 5x5 to 10x30. The indoor units are climate-controlled, and the 10x15, 10x20 and 10x30 sizes also come as ground-floor drive-up units, a mix that serves both household moves and larger loads. We mention it as a real facility in the area, not as a source of demand or performance figures. People relocating to the area can start with our guide to moving to Clermont, FL, and you can learn more on the Sunny Storage hub.
Planning a new facility?
Email ofli@i4capital.com to talk about your site.
Sources
- Self Storage Association, “Self Storage Demand Study, 2025 Edition” (free excerpt PDF; survey fielded February–March 2025; copyright June 2025) (accessed 2026-11-04)
- U.S. Census Bureau, CPS Historical Migration/Geographic Mobility Tables: Table A-1 (mobility rates, 1948–2023), Table A-4 (mobility by tenure, 1988–2023) and Table A-5 (reason for move, 1999–2023), updated December 10, 2024 (accessed 2026-11-04)
- U.S. Census Bureau, “2024 State-to-State Migration Flows Statistics Now Available,” press release, January 21, 2026 and State-to-State Migration Flows table, 2024 ACS 1-year estimates (accessed 2026-11-04)
- U.S. Census Bureau, QuickFacts: Florida and Lake County, Florida (V2025; ACS 2020–2024; Building Permits 2025; Nonemployer Statistics 2024) (accessed 2026-11-04)
- U.S. Census Bureau, QuickFacts: United States (V2025; ACS 2020–2024; Building Permits 2025; Nonemployer Statistics 2024) (accessed 2026-11-04)
- Public Storage, Form 10-K for fiscal year 2025, filed 2026-02-12 (SEC EDGAR) (accessed 2026-11-04)
- Extra Space Storage Inc., Form 10-K for fiscal year 2025, filed 2026-02-20 (SEC EDGAR) (accessed 2026-11-04)
- CubeSmart, Form 10-K for fiscal year 2025, filed 2026-02-27 (SEC EDGAR) (accessed 2026-11-04)
- NOAA National Hurricane Center, Tropical Cyclone Climatology: Atlantic hurricane season dates (accessed 2026-11-04)
Frequently asked questions
- What drives self-storage demand?
- Mostly life events that change how much space a household or business has: moves, new or merged households, divorce, housing changes, retirement and business needs. In the Census Bureau's 2023 Current Population Survey, 41.3% of people who moved did so for housing-related reasons, 22.7% for family reasons and 21.0% for job-related reasons.
- How many U.S. households rent a self-storage unit?
- The Self Storage Association's 2025 Demand Study estimates that 12.6% of U.S. households rented a self-storage unit in 2024, about 16.7 million out of 132.4 million households. The study puts the margin of error for that estimate at plus or minus 1 percentage point.
- Do renters or homeowners move more often?
- Renters, by a wide margin. In the Census Bureau's 2023 Current Population Survey, 16.2% of people living in renter-occupied homes had moved in the past year, compared with 4.1% of people in owner-occupied homes.
- Is self-storage demand seasonal?
- Yes, mildly. Public Storage, Extra Space Storage and CubeSmart all say in their annual reports for fiscal year 2025 that demand or occupancy is generally higher in the summer, which they link to increased moving activity.
- Can public data tell me if one site has enough demand?
- Not on its own. Census and public filings describe the people and life events behind demand. The number of facilities, rentable space and new projects near a site come from paid industry data, planning records or a local field survey.
Related
i4 Capital Group · design-build
or email ofli@i4capital.com